Multi-Property Comparison Tool
Compare up to 5 investment properties side by side
$99
Get My Template - $99Instant download — Excel
What's Included
Instructions
usage guide, scoring methodology, color legend
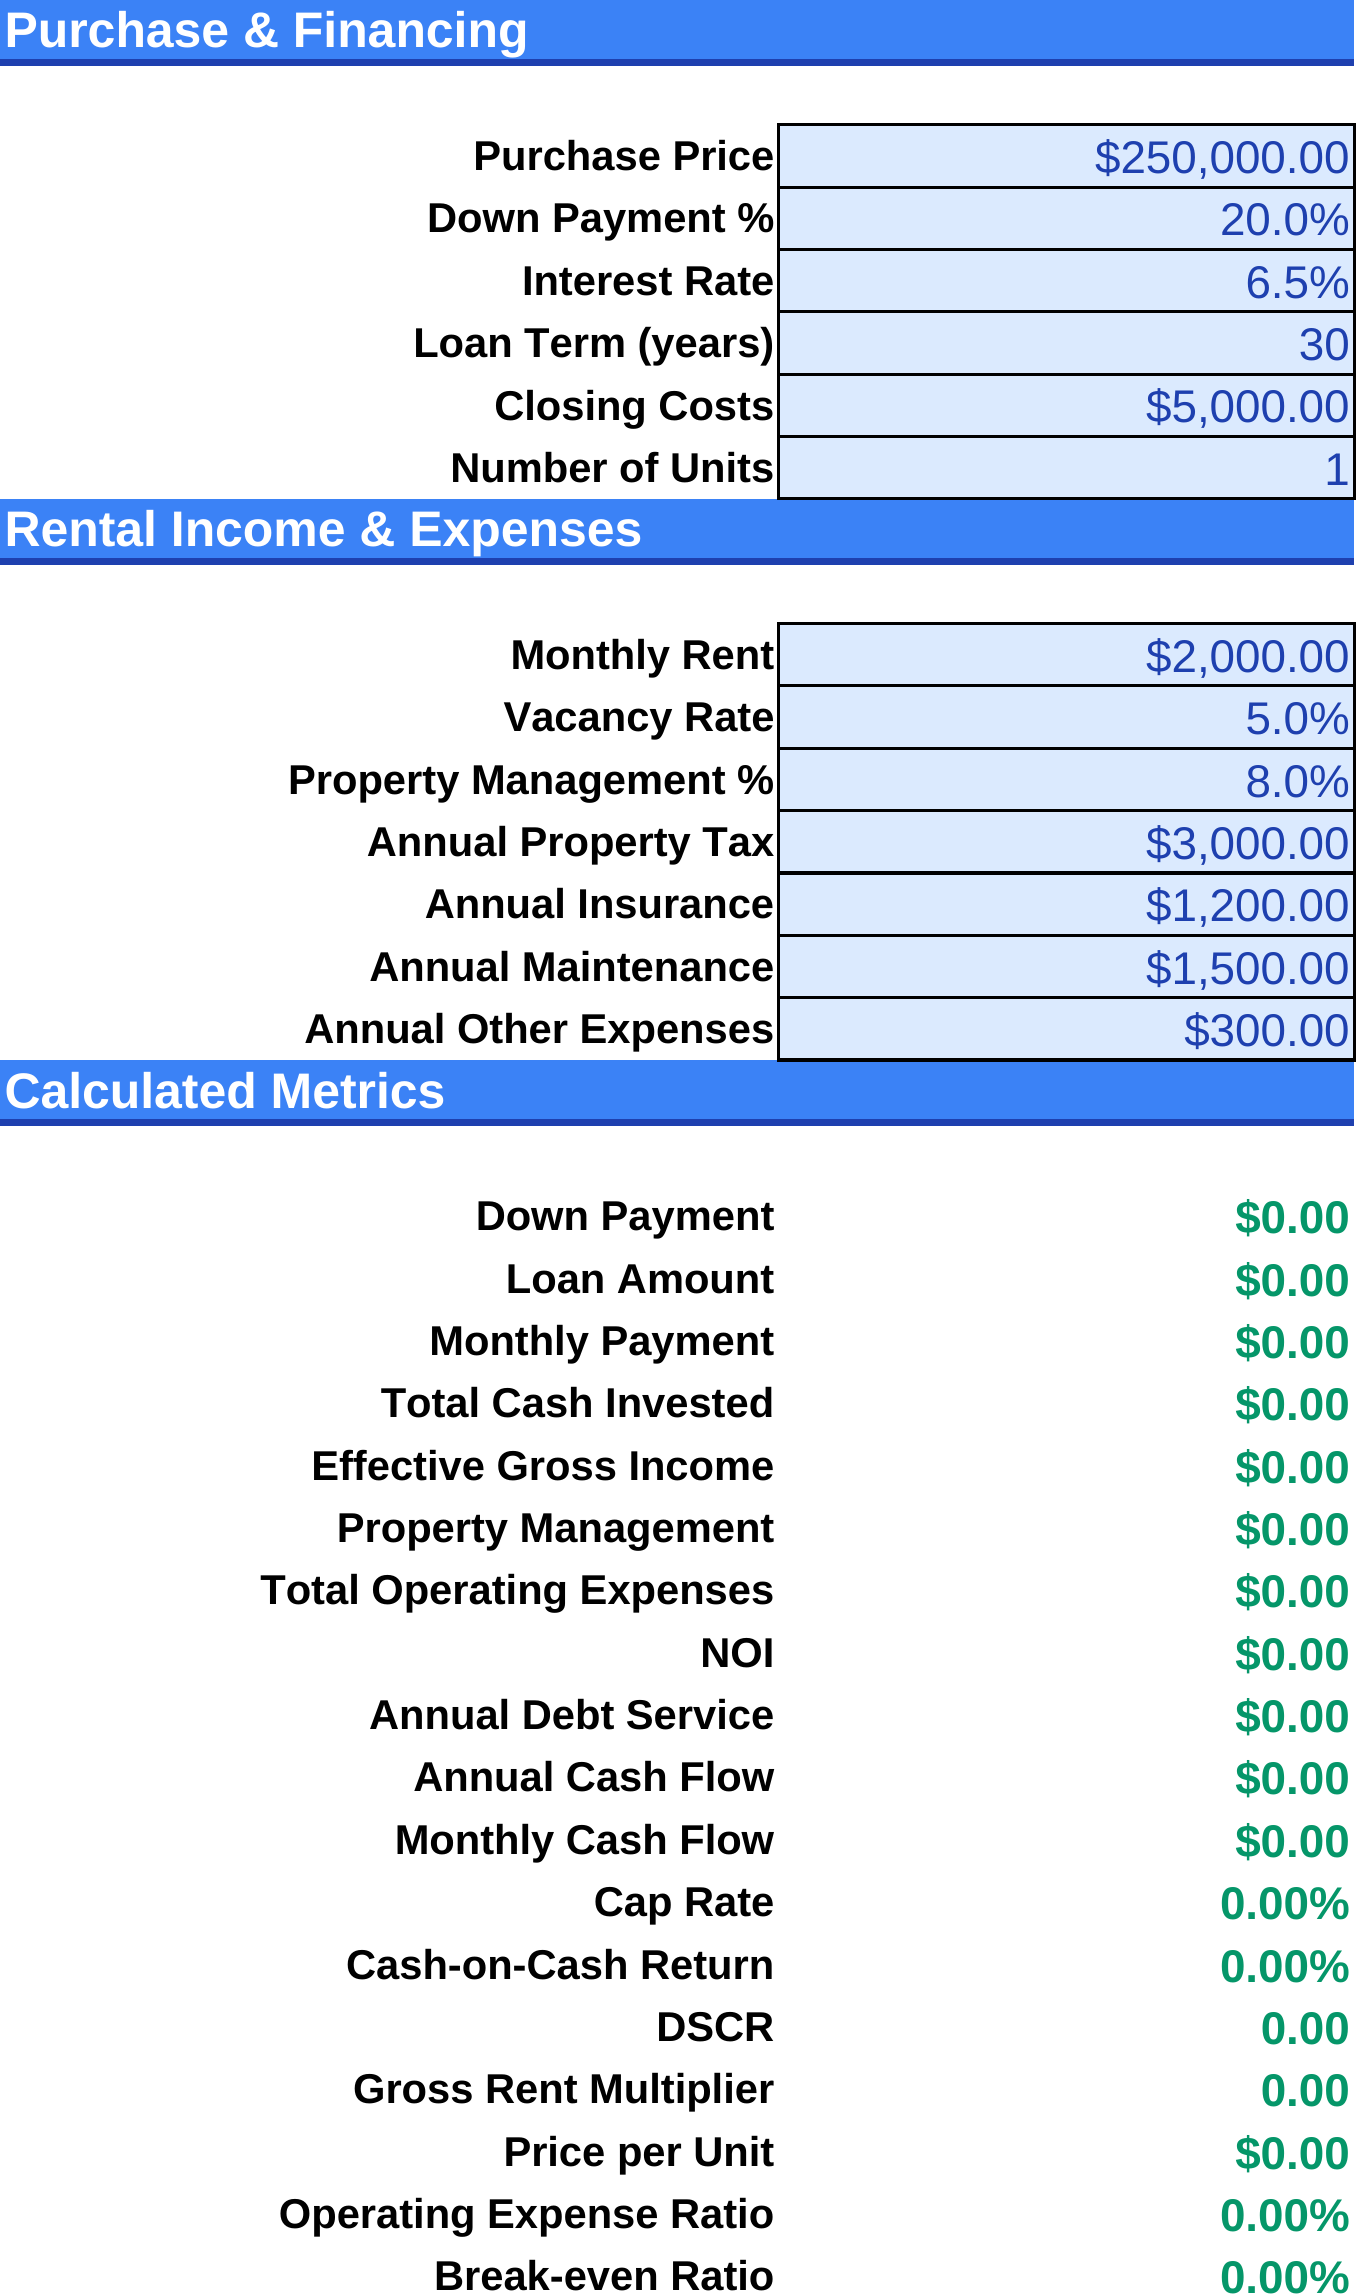
Property 1-5
identical analysis sheets with unique tab colors
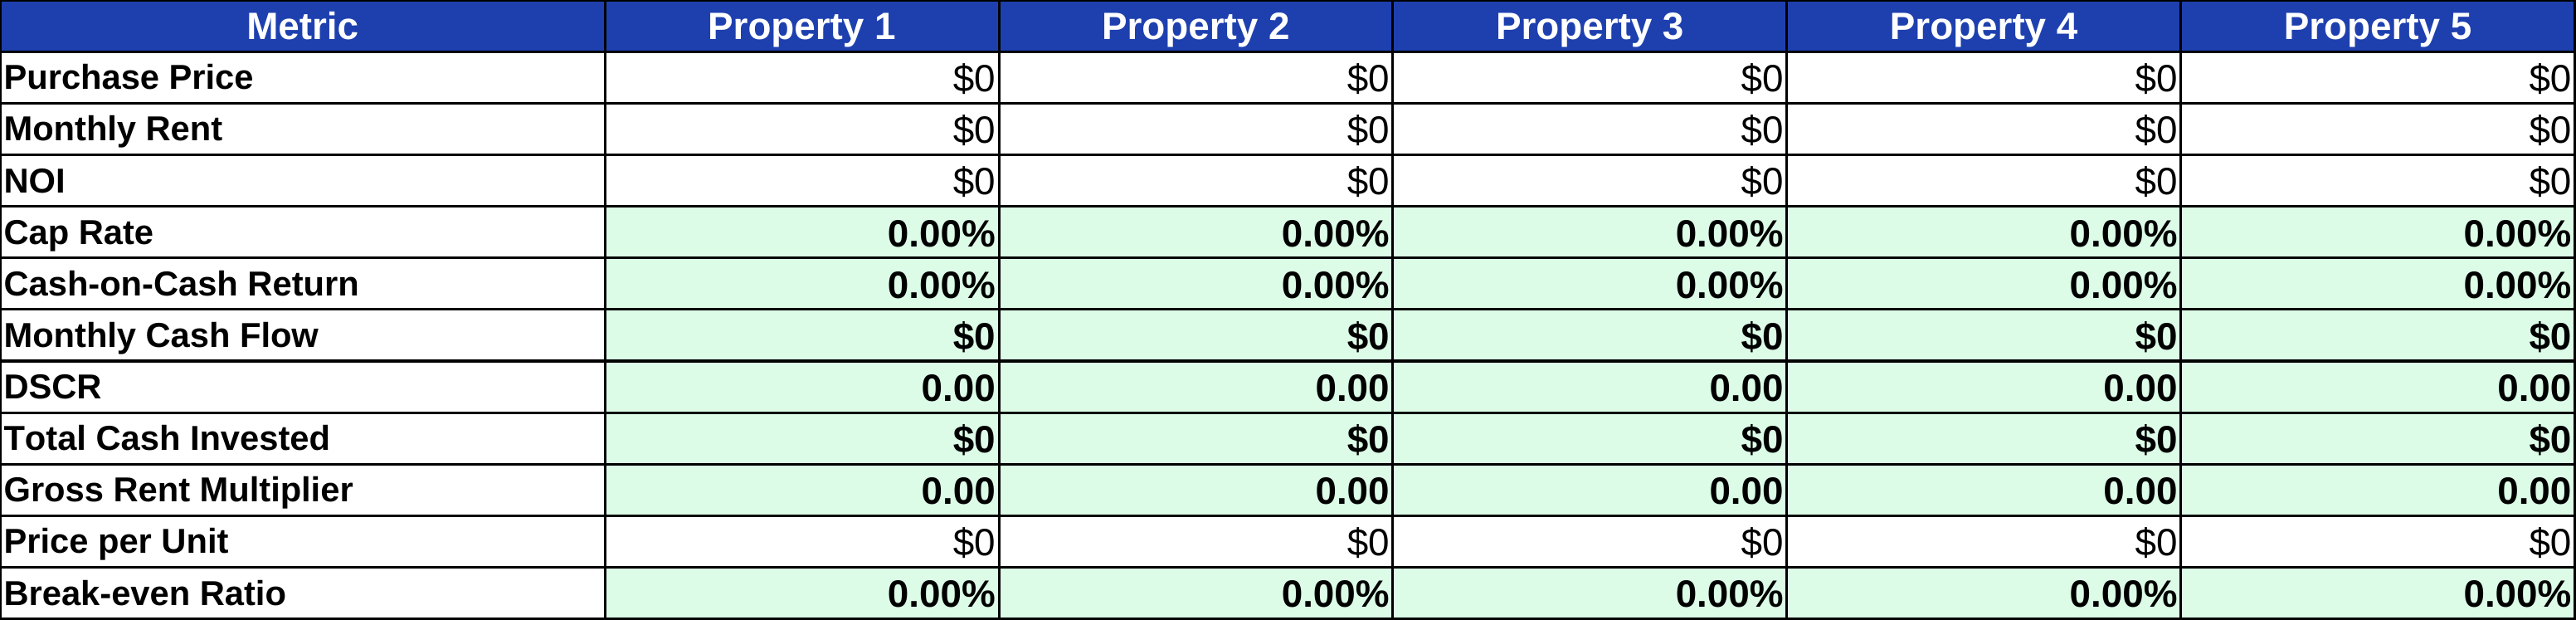
Comparison
side-by-side metrics with best/worst conditional formatting
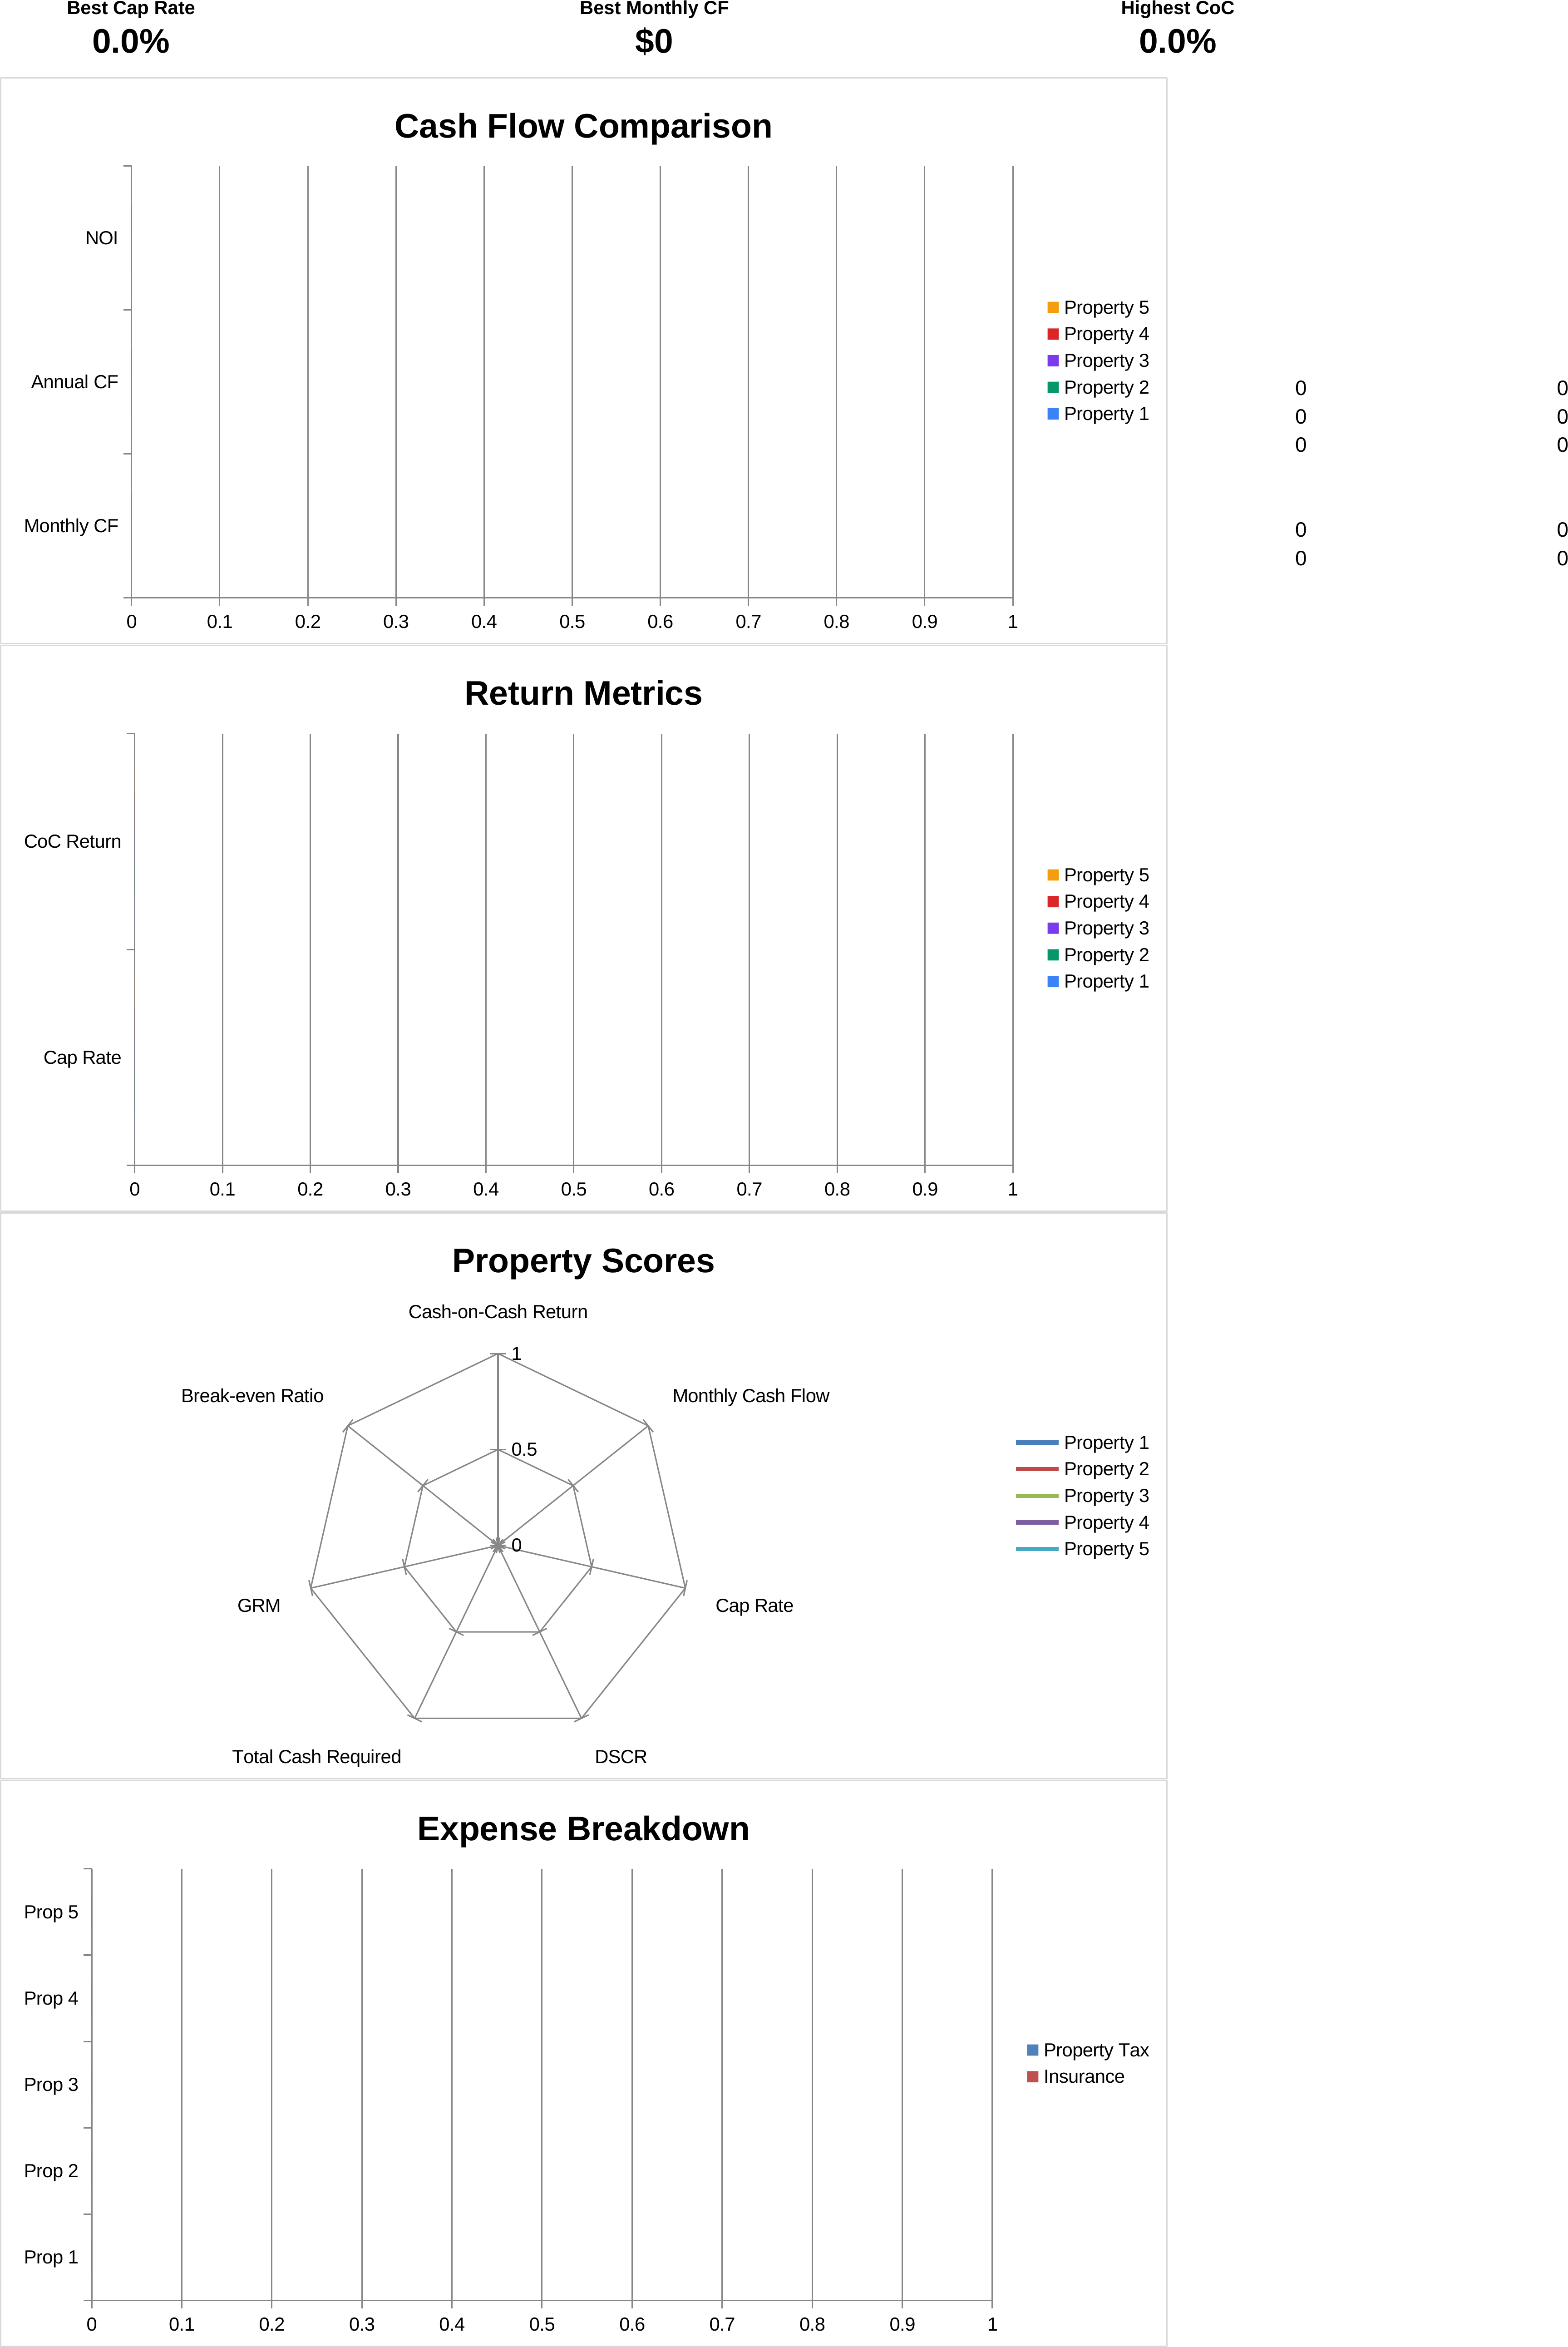
Dashboard
KPI cards and 4 professional charts
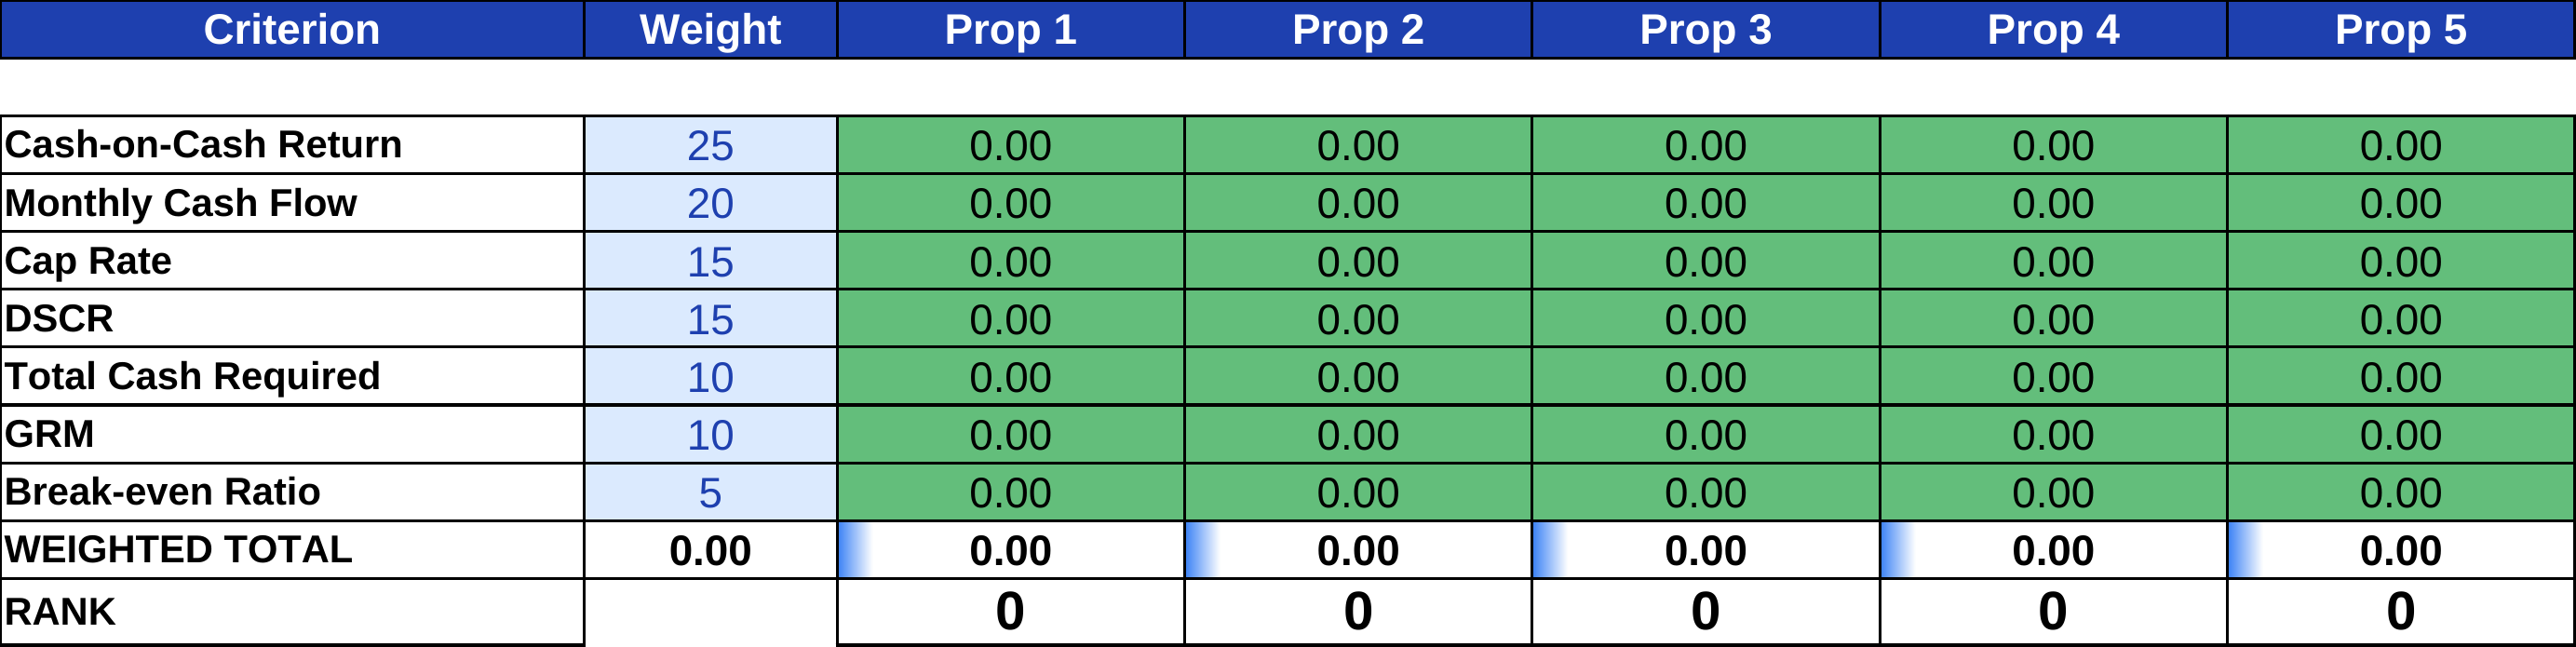
Scoring
weighted decision matrix with customizable priorities
See It in Action
Instant download — Excel
Features
- Compare up to 5 properties side by side with 17 metrics each
- Instantly see which property wins — green highlights best, red flags worst
- Rank properties by what matters to you — customize scoring weights
- Visual dashboard with 4 charts — cash flow, returns, radar scores, expenses
- Handles ties and edge cases — scoring works even with identical metrics
- Get a clear winner with weighted RANK — no gut decisions
- Every formula is transparent — named ranges make auditing easy
- See it in action — 5 sample properties pre-loaded for demo
Instant download — Excel
Frequently Asked Questions
How many properties can I compare? ▾
The template supports up to 5 properties simultaneously. Each property gets its own analysis sheet with identical structure, and the Comparison, Dashboard, and Scoring sheets automatically include all 5.
How does the scoring system work? ▾
Each property is scored 1-10 on 7 criteria using linear interpolation (best property gets 10, worst gets 1). Scores are weighted by your investment priorities — you set the weights. SUMPRODUCT calculates weighted totals and RANK determines the winner.
Can I change the scoring weights? ▾
Yes. The weight cells on the Scoring sheet are the only unlocked cells (besides property inputs). Default weights sum to 100 and reflect a balanced strategy. Adjust them to match your priorities — for example, increase Cash Flow weight if you optimize for income.
What metrics are compared? ▾
The Comparison sheet shows 11 metrics including Cap Rate, Cash-on-Cash Return, Monthly Cash Flow, DSCR, NOI, GRM, Total Cash Required, Price per Unit, Operating Expense Ratio, and Break-even Ratio.
What's the refund policy? ▾
We offer a 30-day money-back guarantee. If the template doesn't meet your needs, contact us for a full refund — no questions asked.
Professional property analysis costs $500+/property
$99
One-time payment — use for unlimited properties
Get My Template - $99Instant download — Excel
30-day money-back guarantee
Related Calculators
For informational and educational purposes only. Not financial advice. Full disclaimer.